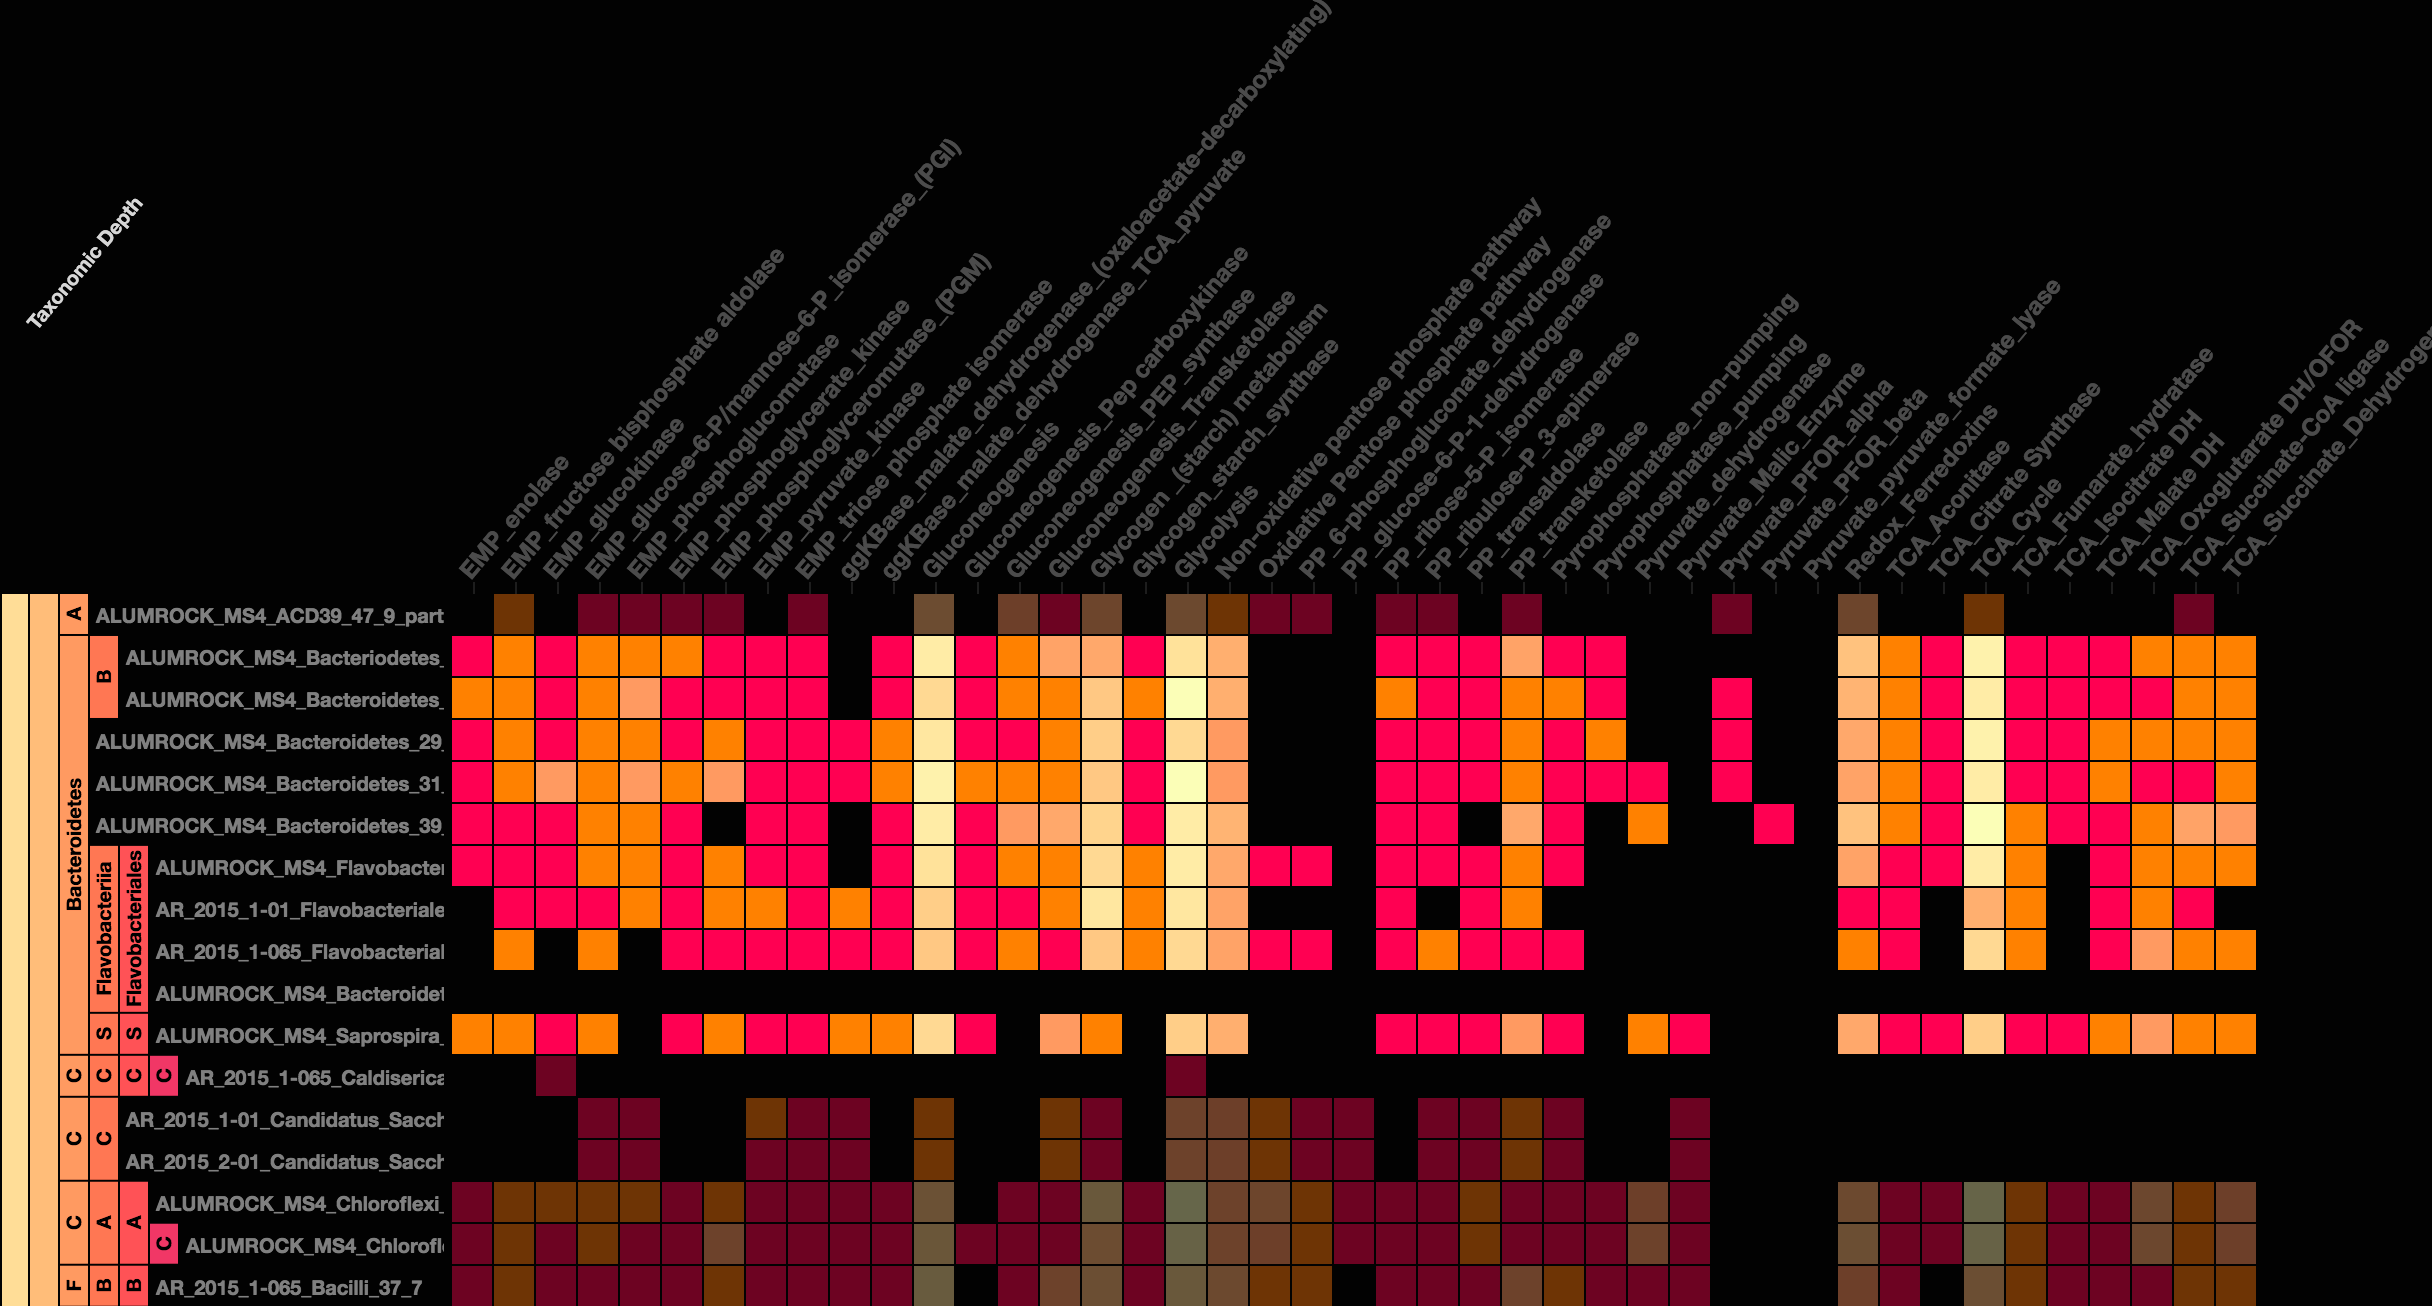
Example of newly designed genome summary display.
The new version of the ggKbase Genome Summary visualization tool is ready! We have made several improvements, notably…
- Load speed: Data loading is now much faster. Although this will still take longer as the size of your grid increases, it loads data at blazing speeds compared to the original/classic tool.
- Visualization: The design of the new GS is focused on maximizing the information content delivered. Due to the enormous data density that can potentially be displayed on these grids, several new color schemes were developed that assist in highlighting information-rich regions of a GS. Additionally, as the number of rows and columns increase, in the classic GS you would quickly run out of “screen real estate” and end up having to scroll left or right. There is now an ability to modify cell size on-the-fly.
- Rich data display: Several features have been added to improve visualizing the count data in the cells. This includes a unique bar-graphing feature as you hover the row/column titles. Additionally we have added a legend to clarify how the changing color intensities indicate changing count levels.
- Taxonomy: The ability to overlay taxonomic information onto a GS was a much-requested feature. The new GS now displays hierarchical taxonomy data, and in addition, several other methods for sorting the rows in the GS are available (e.g. sorted by coverage, alphabetically, or custom).
- Interaction: The information-rich content in the new GS lets you interact with the data. You can use the mouse to hover over individual rows, columns, or cells and get detailed information. Also, with the Taxonomy Overlay showing, you can “freeze” nodes in the taxonomy hierarchy simply by single-clicking a taxonomy node (e.g. Phylum-Bacteroidetes). What this does is focuses the mouse-related information display only on your selected region.
- Output: We realize there may be times when you want to overlay data or otherwise alter the GS displays you create. The new genome summary displays can be saved as either text (tab-separated value files) or as a Scalable Vector Graphics (SVG) file.
- “classic” features: Change is hard sometimes. We’ve tried to maintain key features in the original GS implementation that users may expect. It supports classic color schemes (which are the default setting), user-defined organism ordering, and the ability to download your genome summaries in TSV or SVG. Hopefully these consistencies will make the new system easy to adjust to.
For more detailed information on how to use the new system. Please read here.
We hope you enjoy the new Genome Summary. Our friends at Stamen have really helped us to take the GS to a new level, and we think you’ll agree!
If you notice any problems, please help us out by reporting them (using our help system on ggKbase). You can also make feature requests using the same system.
Thanks!
bct & Shufei