The genomic data in ggKbase is organized by the following data types and hierarchy:
- ProjectGroup
- Project
- Organism
- Contig
- Sequence
- Feature
- Annotation
- dbXref
- Contig
- Organism
- Project
Project Navigation
You can go to the Projects landing page by clicking on the Projects link on the top menu anywhere on the website. The dropdown menu (shown as a list image) next to the Projects is a shortcut for you to see the list of accessible projects.

Link to Projects on the top menu.

Dropdown list for all accessible projects on the top menu.
You can also go to the Projects page by clicking on the green “Explore projects” button on the home page.
Explore project button.
Note: The list of projects that you can see on the Projects page depends on your user account permissions.
Project Group
Projects are organized into “Project Groups,” based on different factors, such as study site or type. However, one project can only belong to one project group.
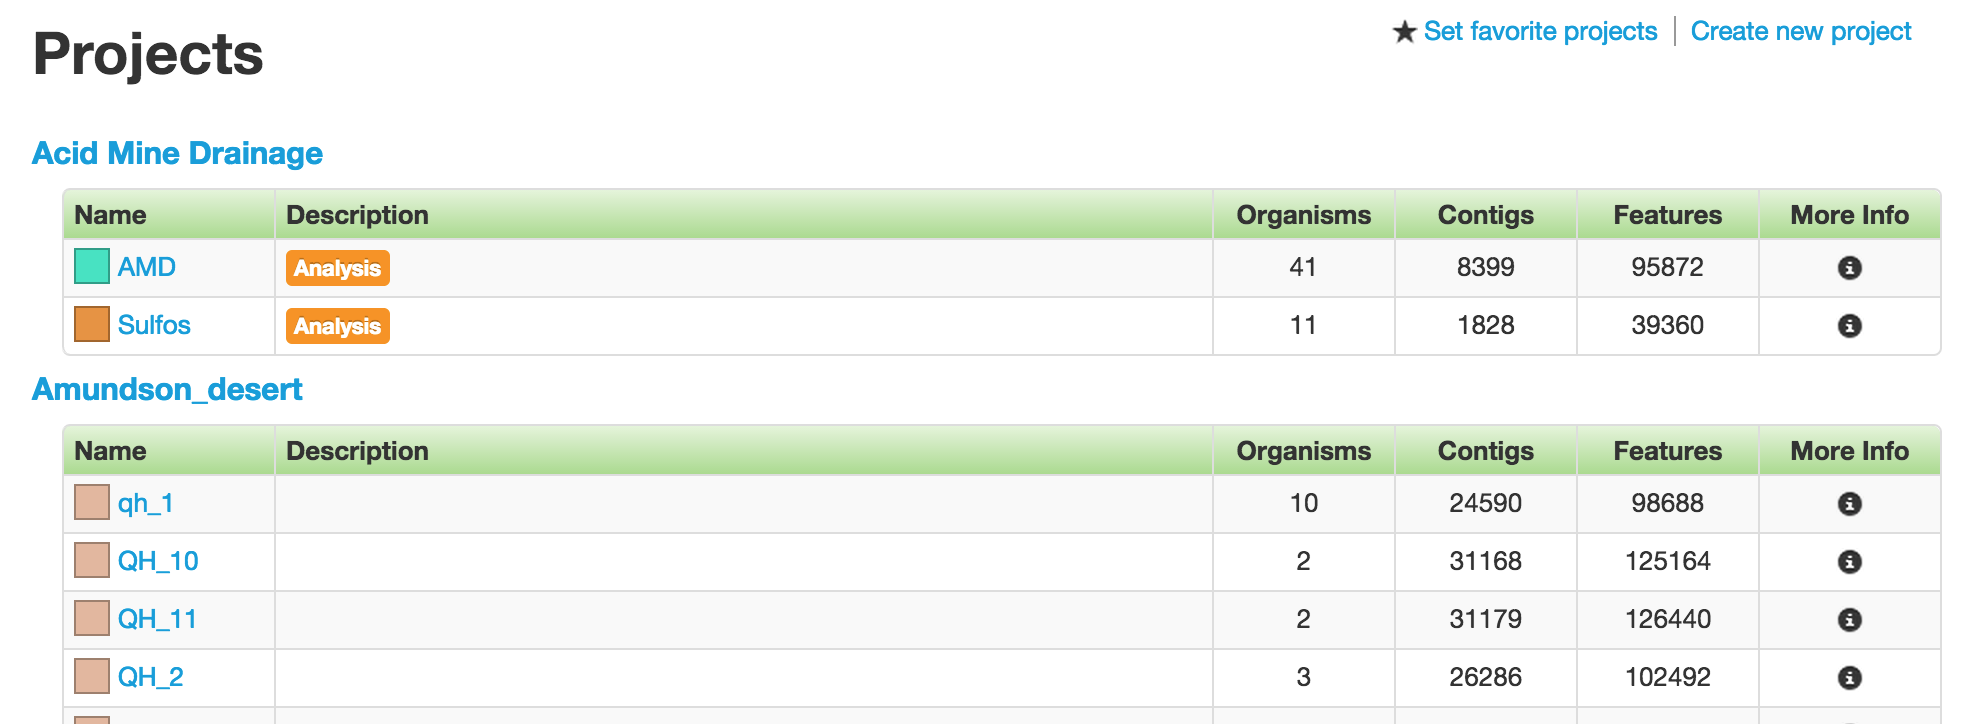
All accessible projects grouped by Project Groups.
Each table row is one project. The first two columns have the name and description of the projects. Following them are the number of organisms, contigs, and features in the projects, which serve as the other three basic data type in ggKbase.
Project
When a project is selected, you will arrive at the Project page that displays all the organisms in the project. There are two types of projects in ggKbase: binning and analysis projects.
Binning Project
If the project is of the binning type, which is the majority of the projects in ggKbase, you will have the metagenome or unknown bin that contains the entire raw genomic data sample. The Metagenome bin will undergo the binning process, which aims to identify and separate individual organisms. They are placed in the table, sorted by the abundance of the organisms, under the “Bins” header.
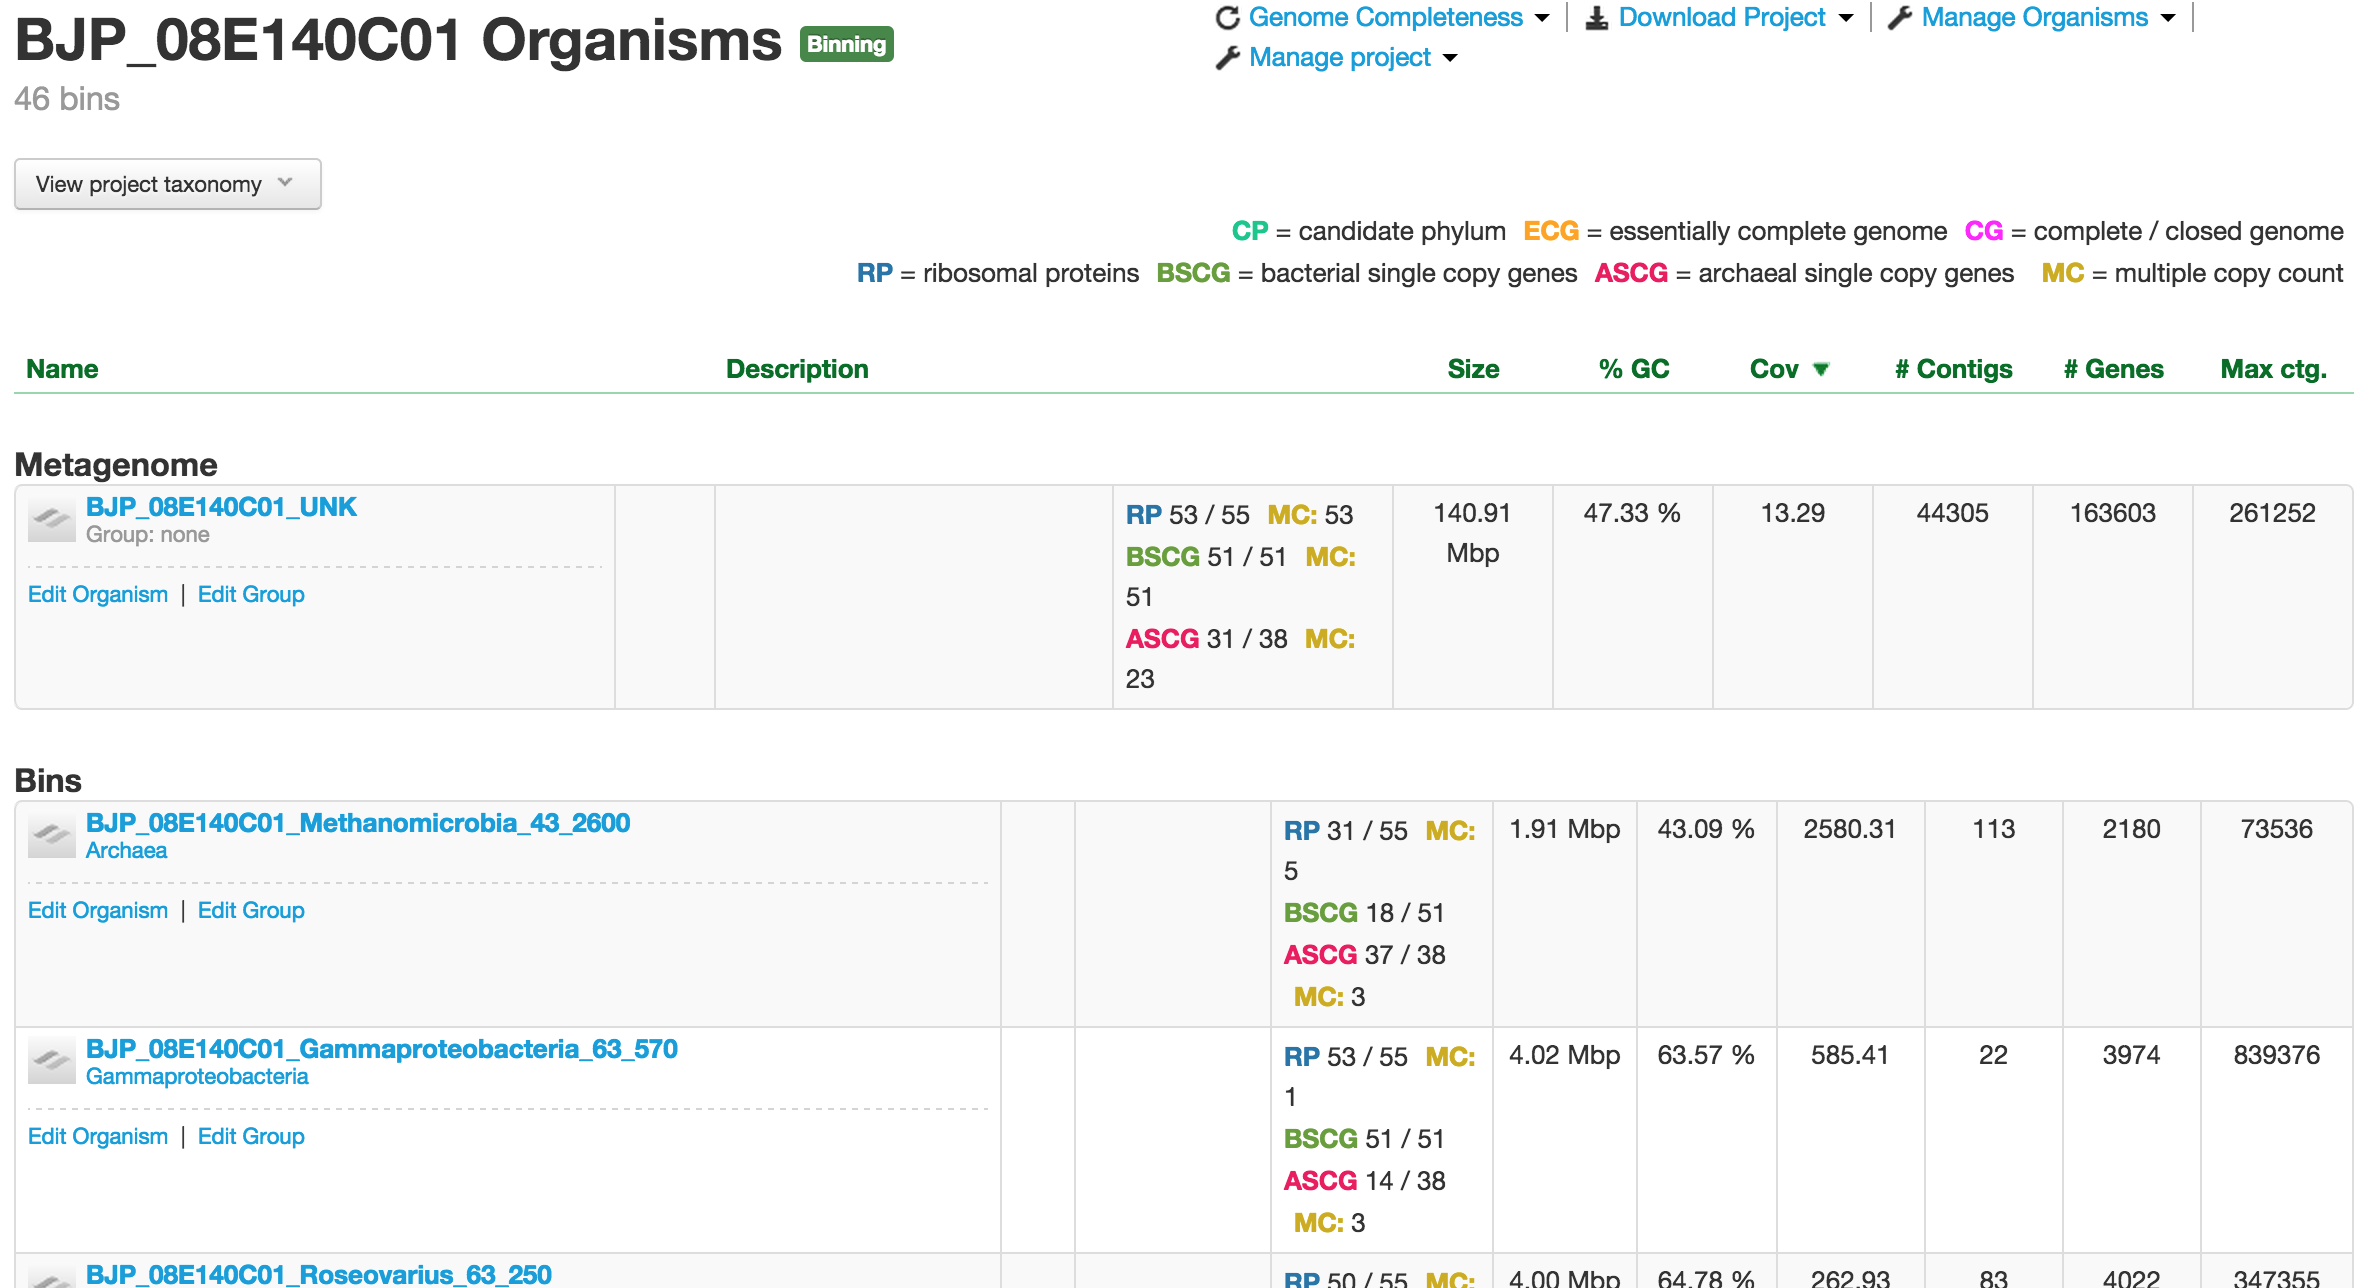
Binning project organisms page.
Analysis Project
For analysis project, the Project page does not have the Metagenome bin. It usually contains bins from many different sources, including outside reference genomes. Usually, genomes with some common characteristics are placed in an analysis project. For example, this would make it easy to produce a genome summary based on certain collection of bins.
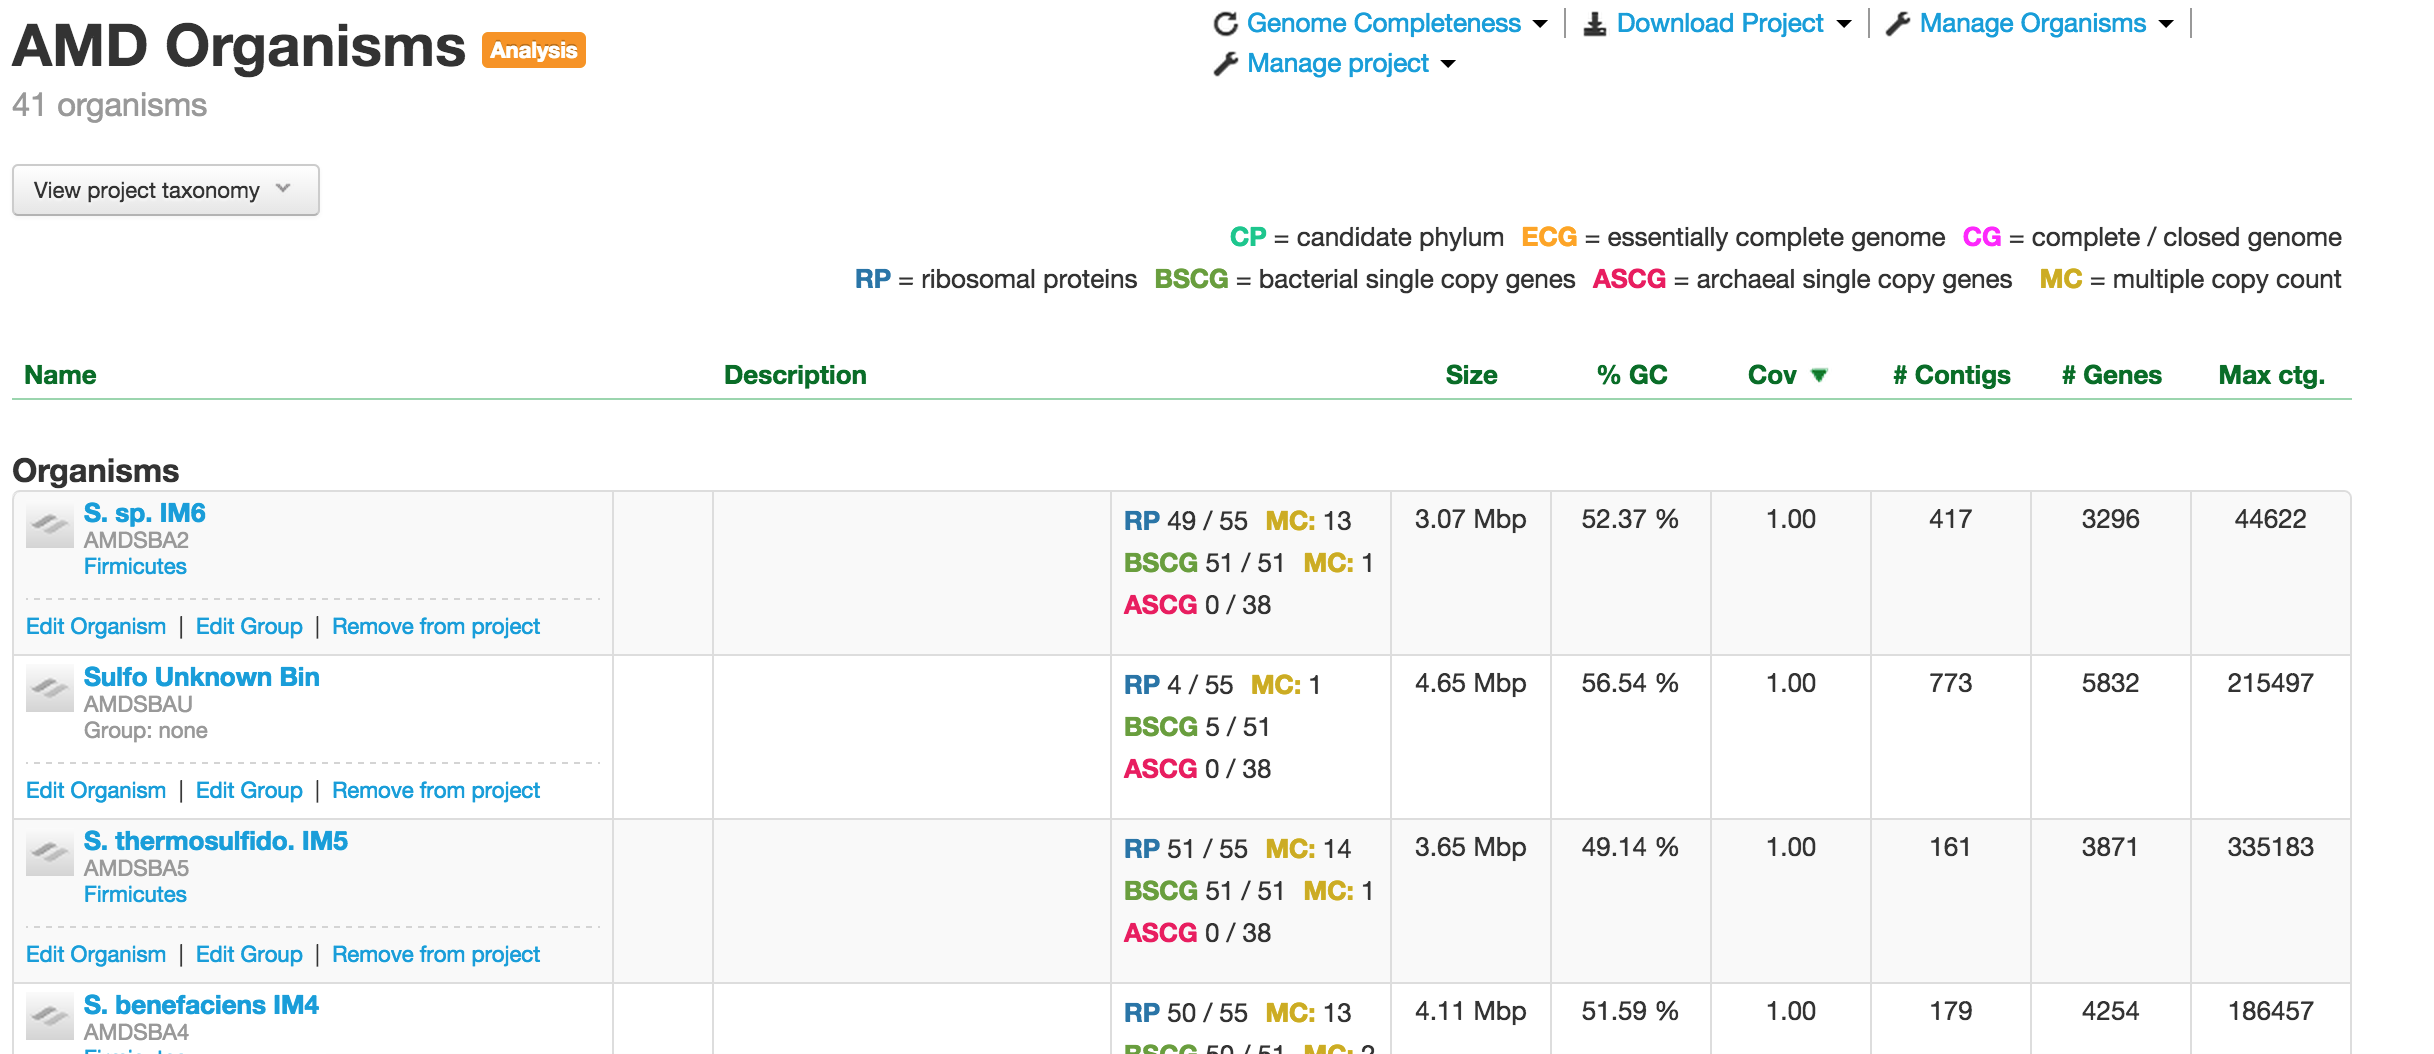
Analysis project showing organisms.
Organism
When you click on one of the projects in the table, you enter into the Organism page. This page provides you a wealth of information about the organism. At the meta level, there are Metagenomic Context, Taxonomy, Properties, and Genome completeness – contained in the four boxes below the the name of the organism.
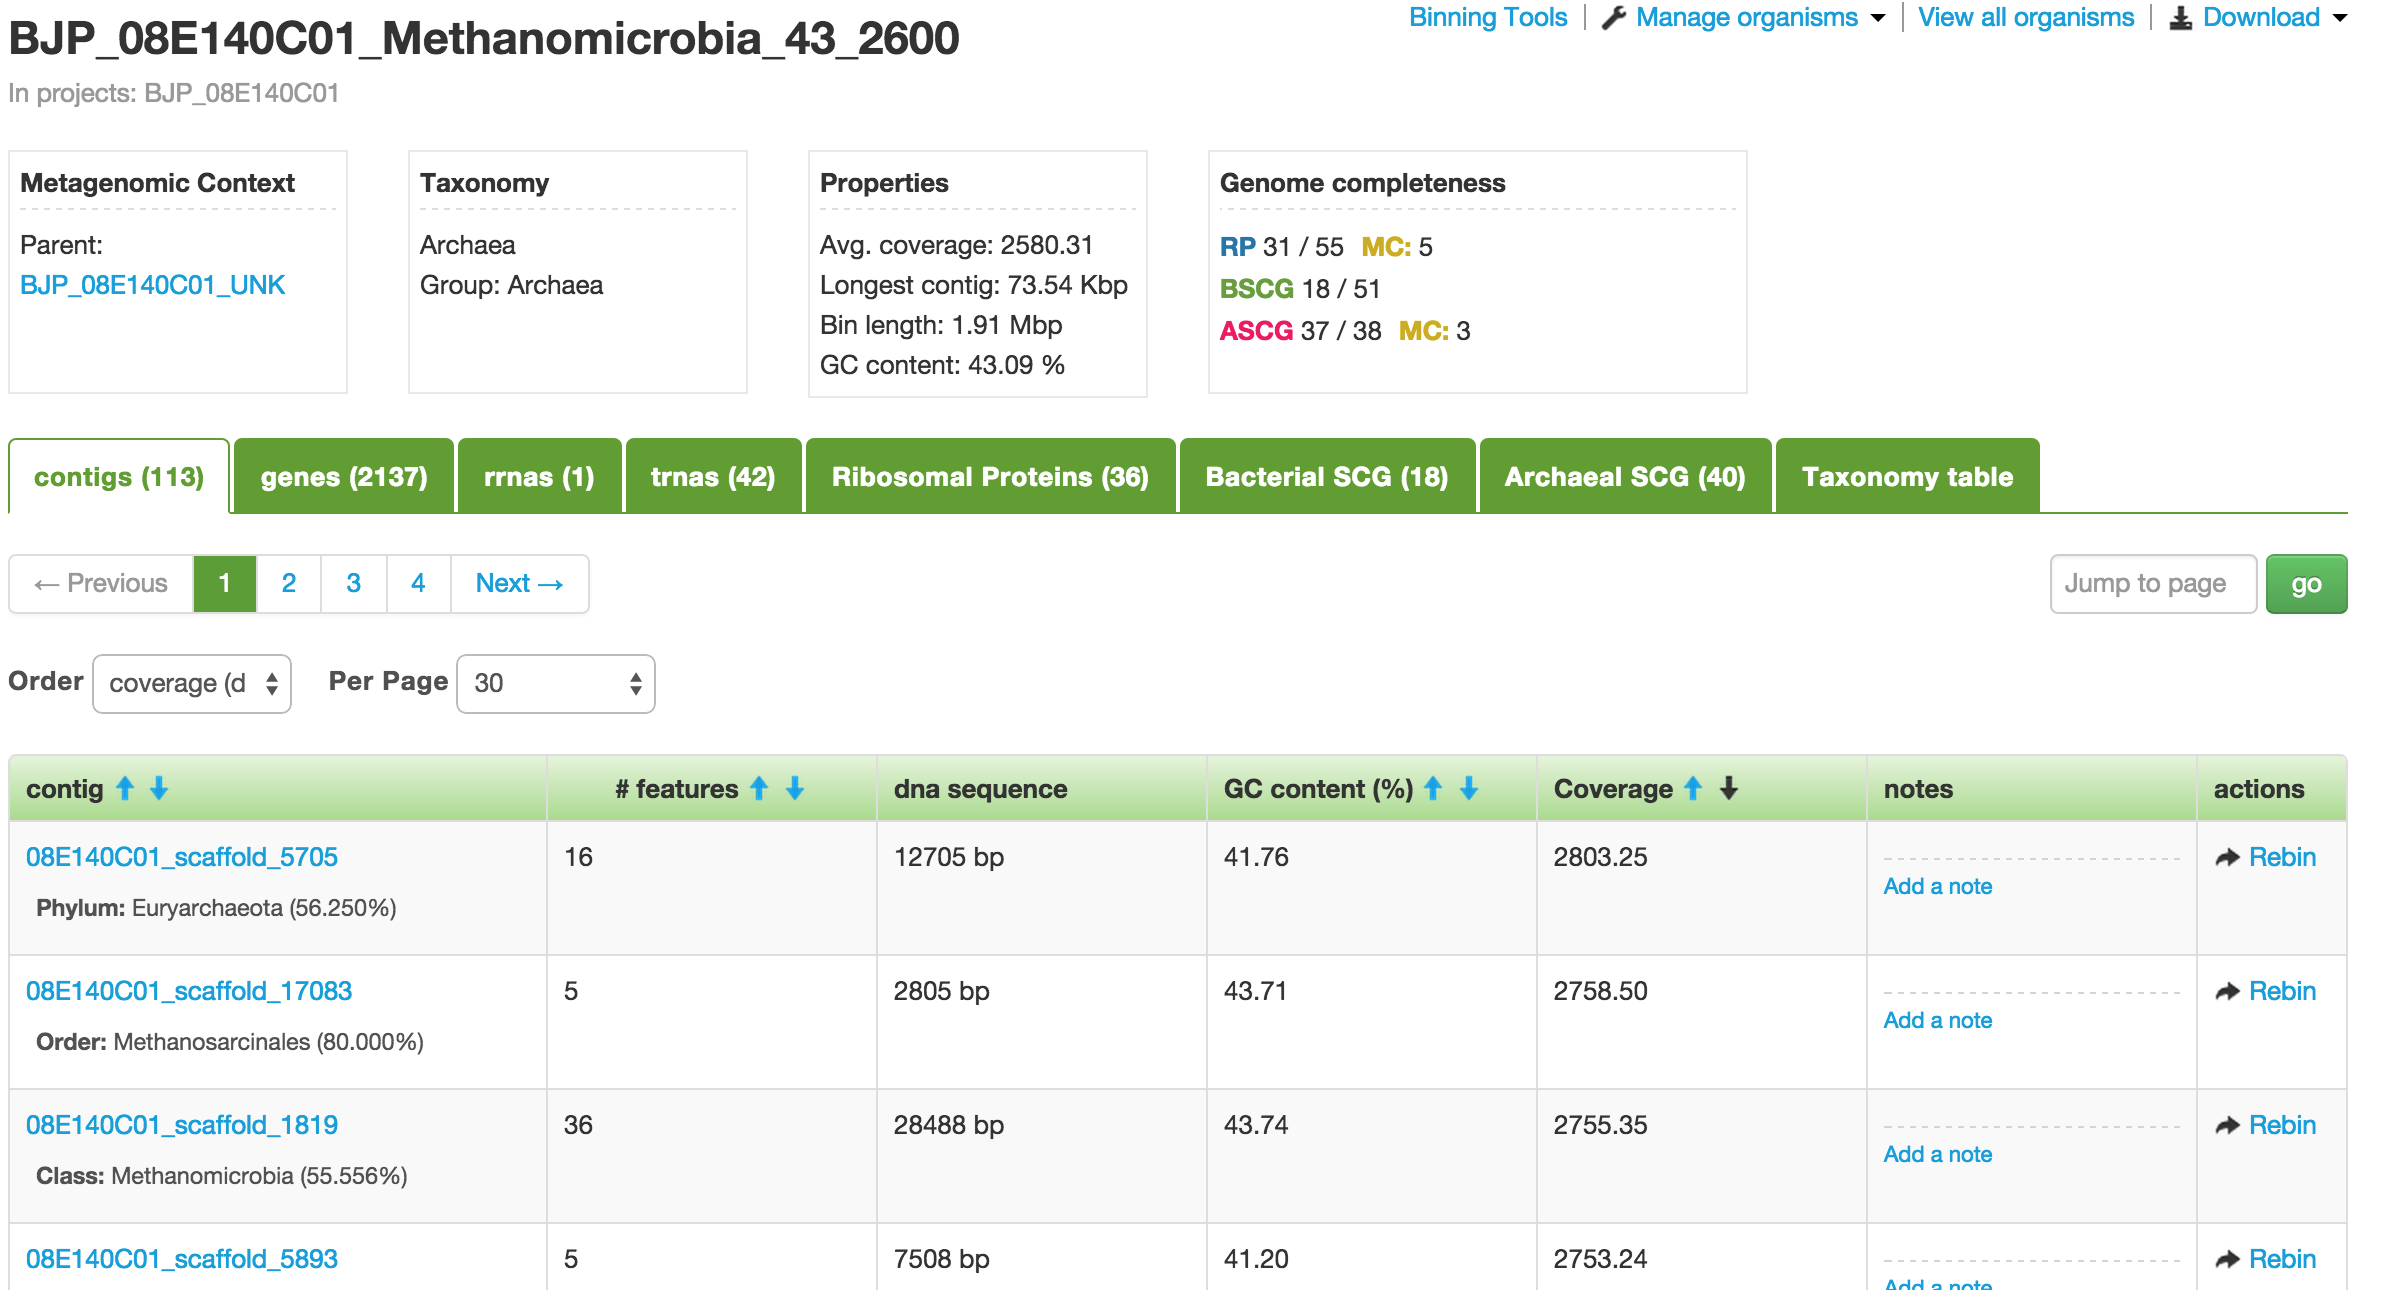
Organism showing all the contigs or scaffolds.
Below them are tabs of tables containing the number of contigs, genes, rnas, trnas, ribosomal proteins, bacterial SCGs, archaeal SCGs, as well as the taxonomy table. These tables can be sorted by different headers. For example, the contigs table can be sorted by name, number of features, GC content, and coverage.
Contig or Scaffold
When you click on one of the contigs in the Organism page, you will be taken to the Contig (a.k.a. Scaffold) page that displays all the genes or features that make up that contig.
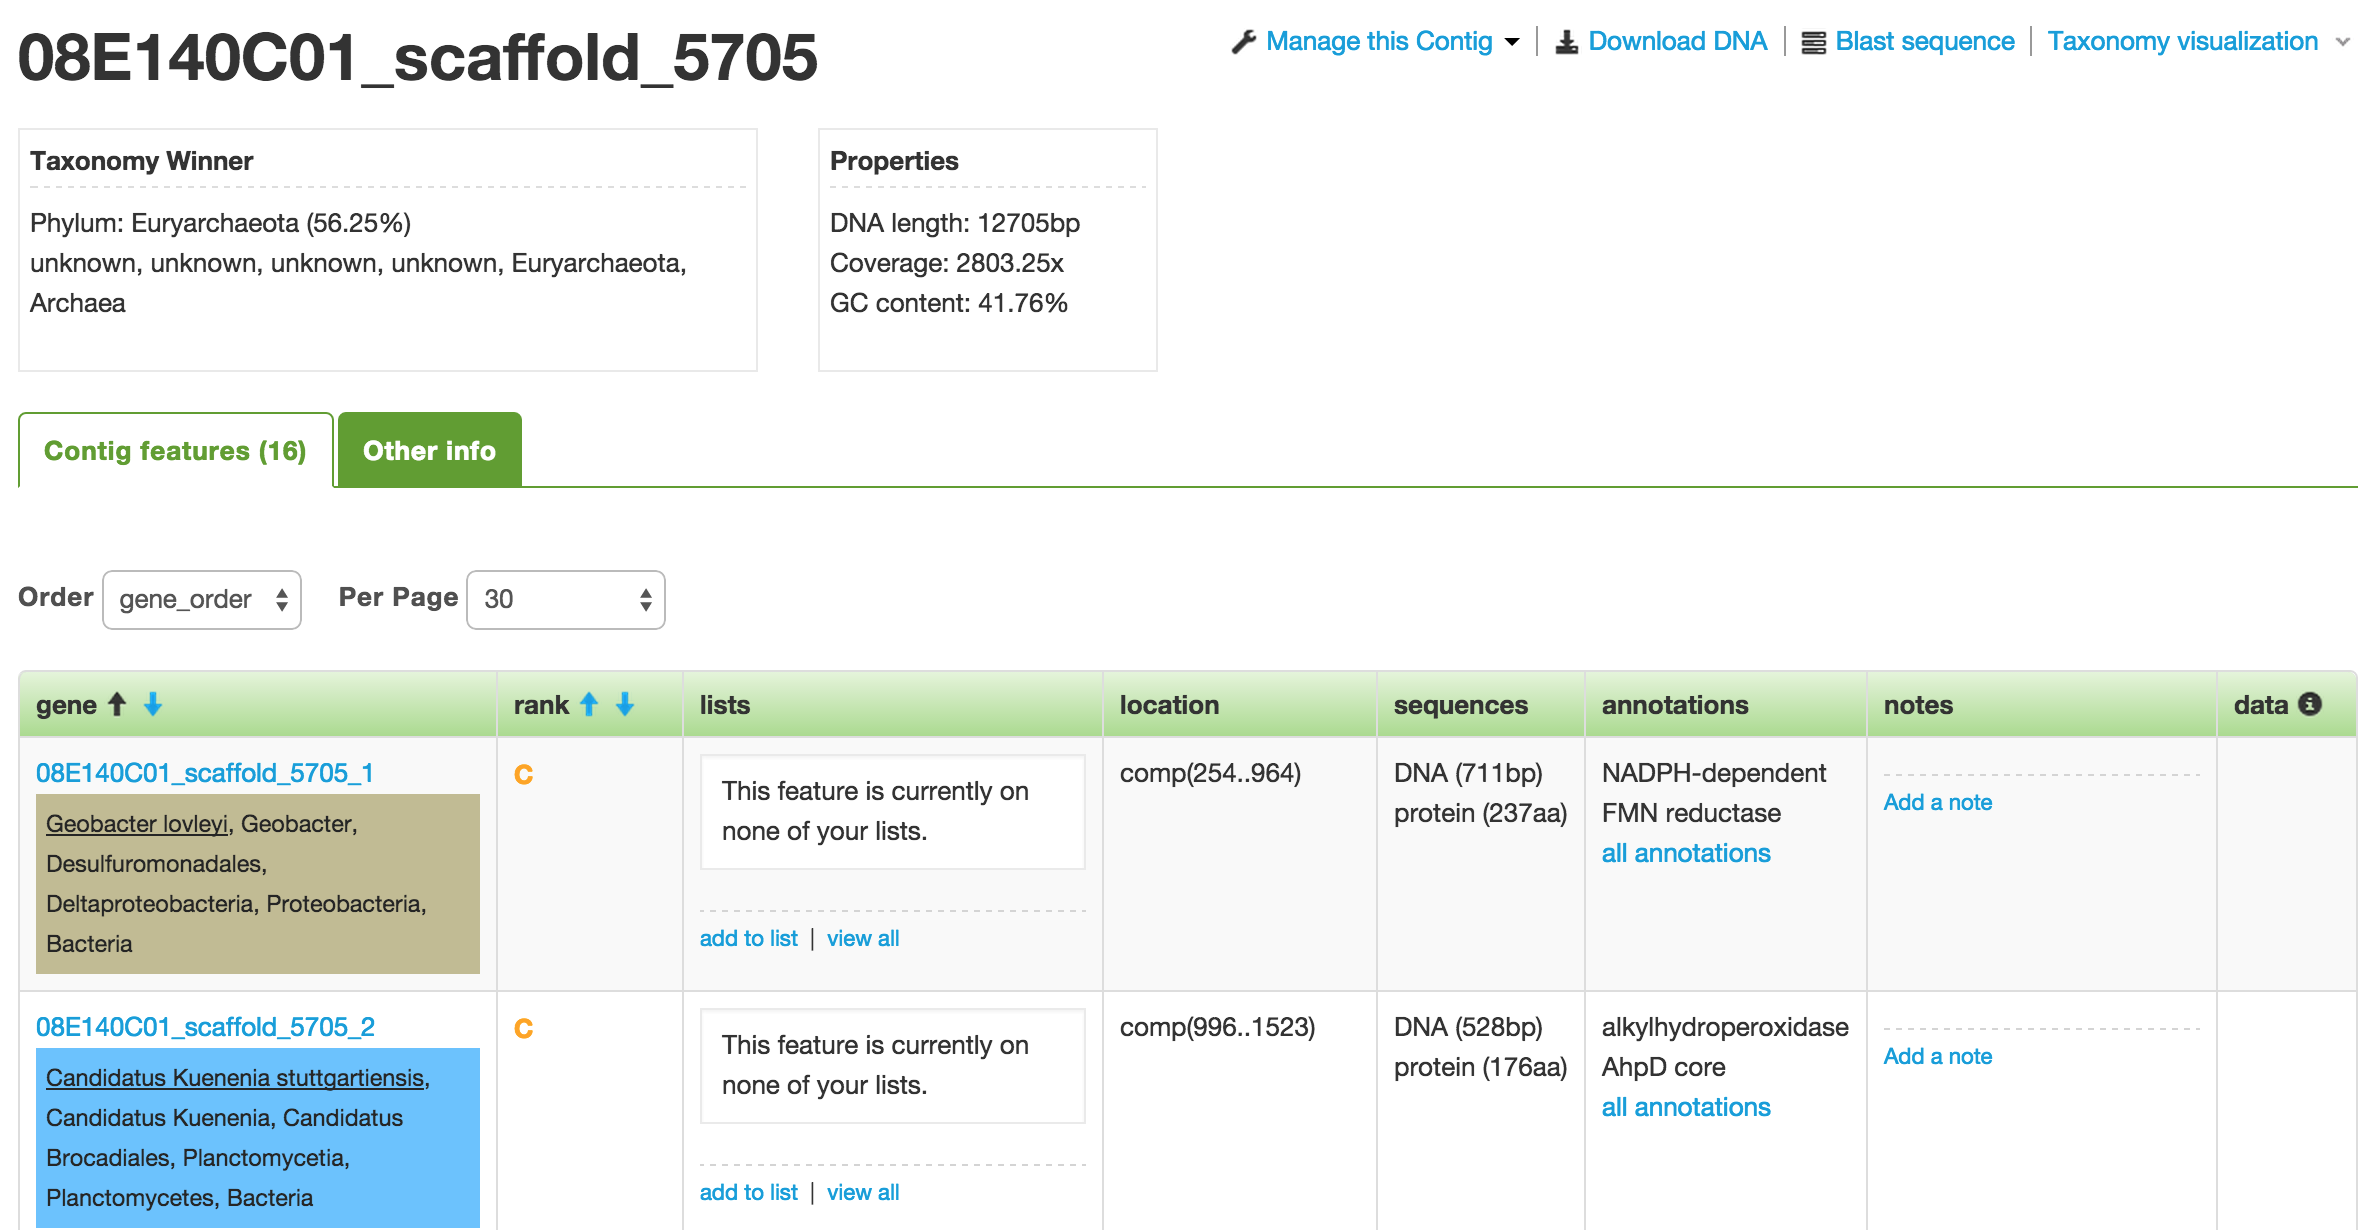
The Contig page showing all the genes or features.
The first box below the name of the contig shows you the taxonomy winner at different taxonomy levels. The taxonomy winner is determined by the majority (>50%) of the phylogenetic makeup among the genes that make up the contig. Each gene has been taxonomically classified based on their annotations. Each classification corresponds to a specific color.
On the Contig page, you are provided with a number of actions, such as Download DNA, Blast sequence, and Taxonomy visualization.

Taxonomy visualization of the contig.
Feature or Gene
Features or genes are the smallest building block in ggKbase. They are first annotated by being BLASTed against the NCBI database. Further annotations may be added manually by researchers.
On the Feature page, you are shown all the details about the feature, including its Top 3 Annotations, Cross References, Similarities, and Sequences. You can also add it to a list and put additional notes about the feature.

Details of a feature or gene.